Visualize
OptiNiSt visualizes the analysis results by plotly.
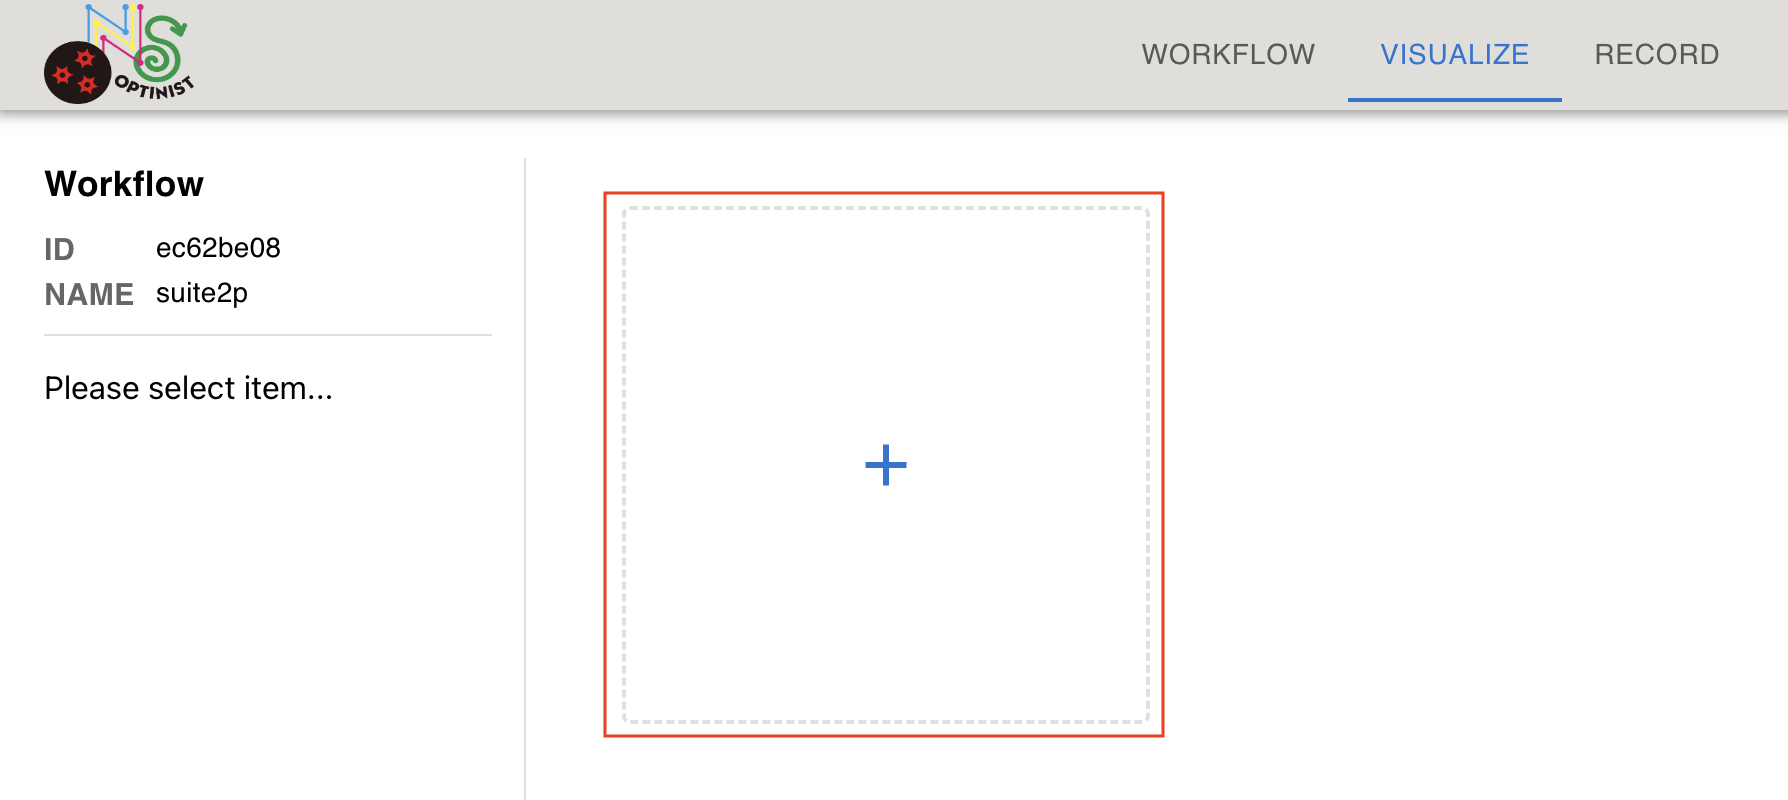
Adding a display box
Click the “+” button to create a display box.
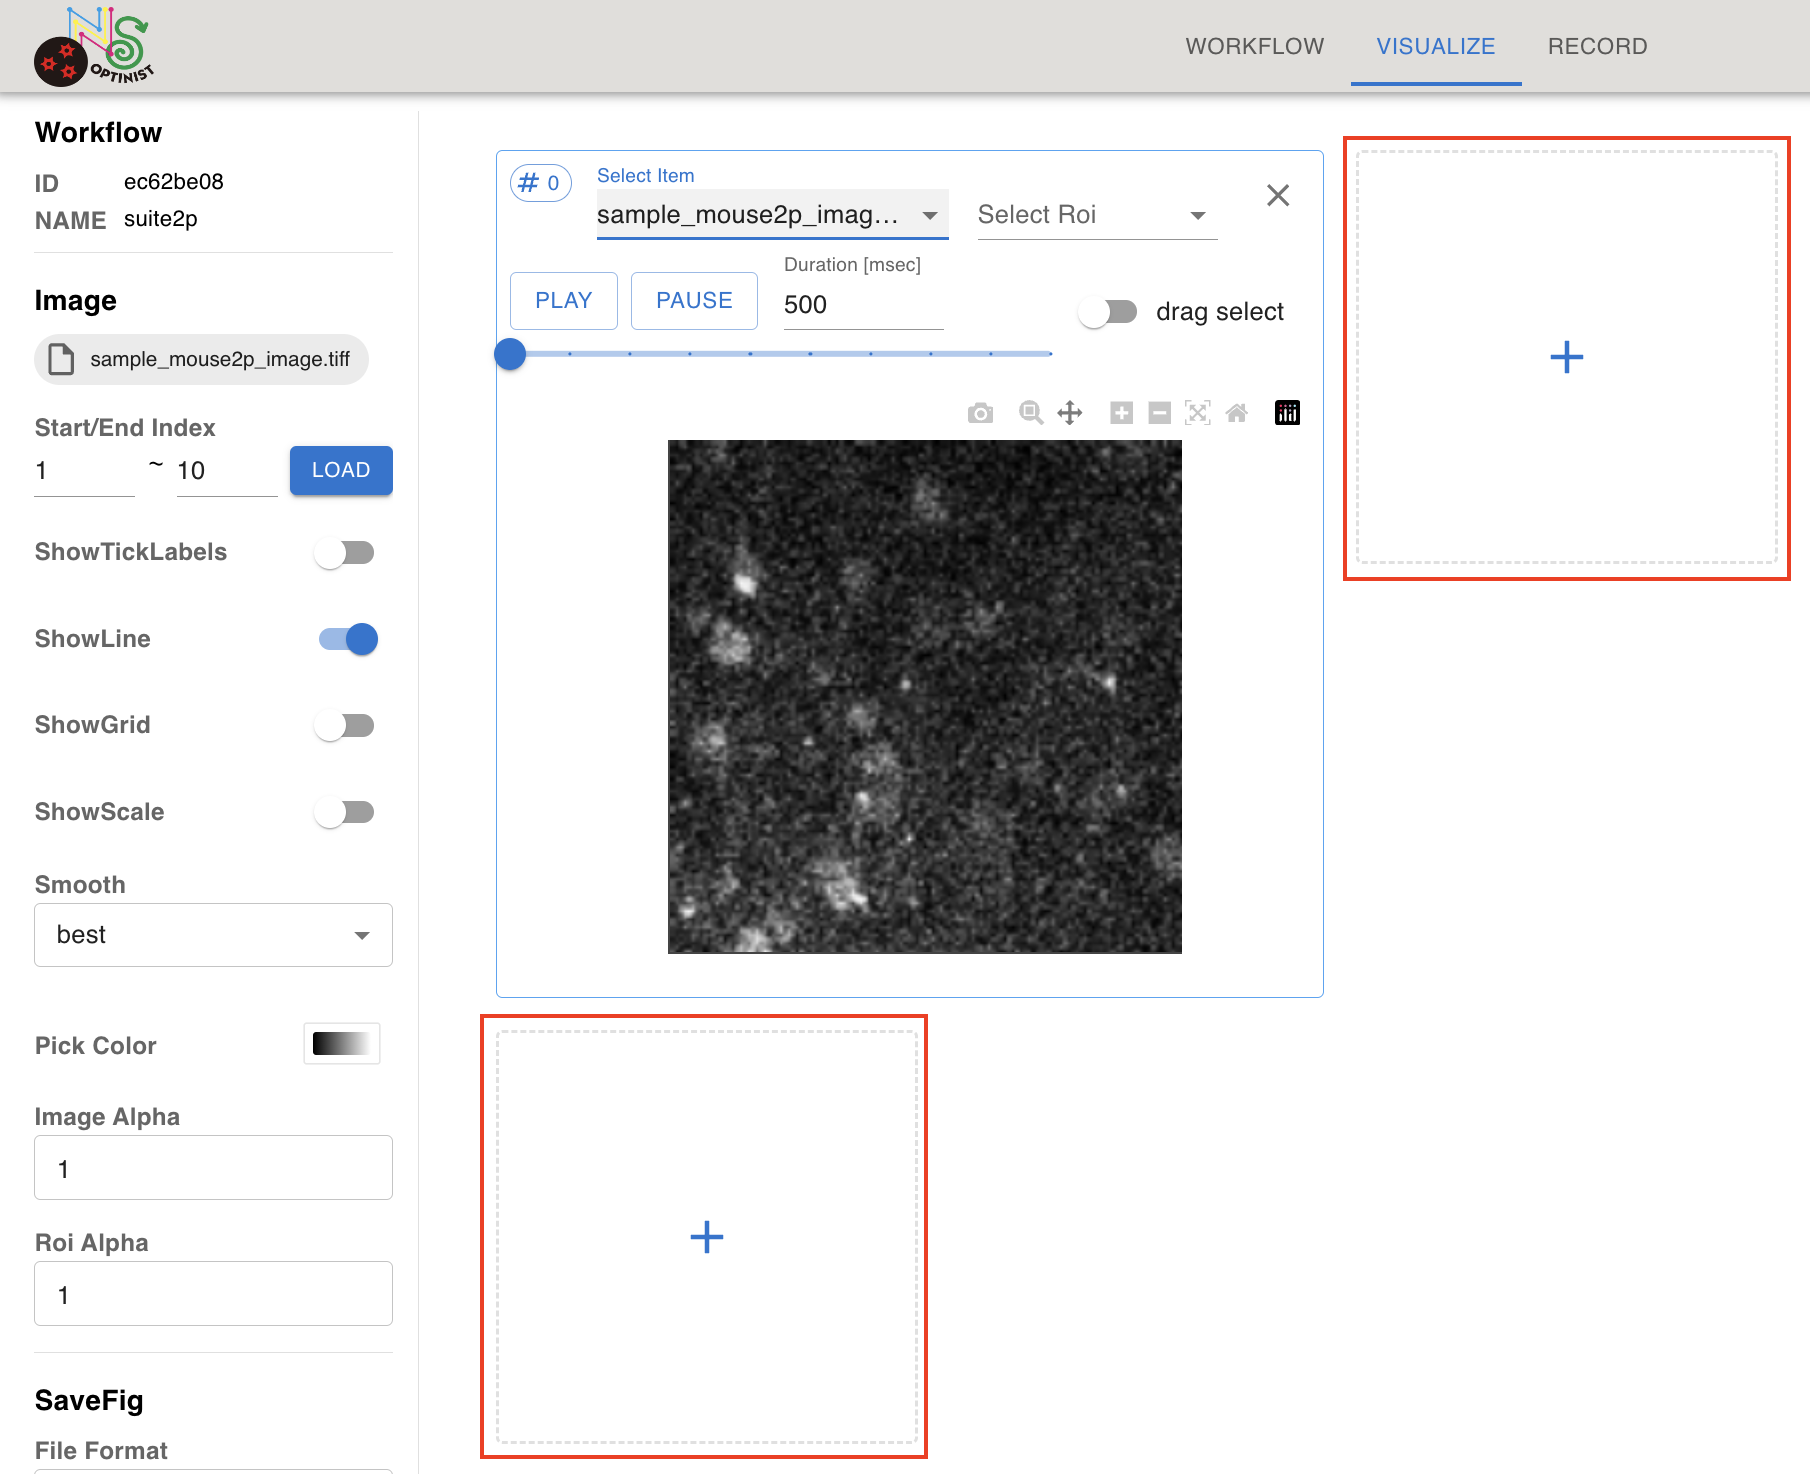
To add another display box , click the “+” button. You can add new boxes to the next row or the next column.
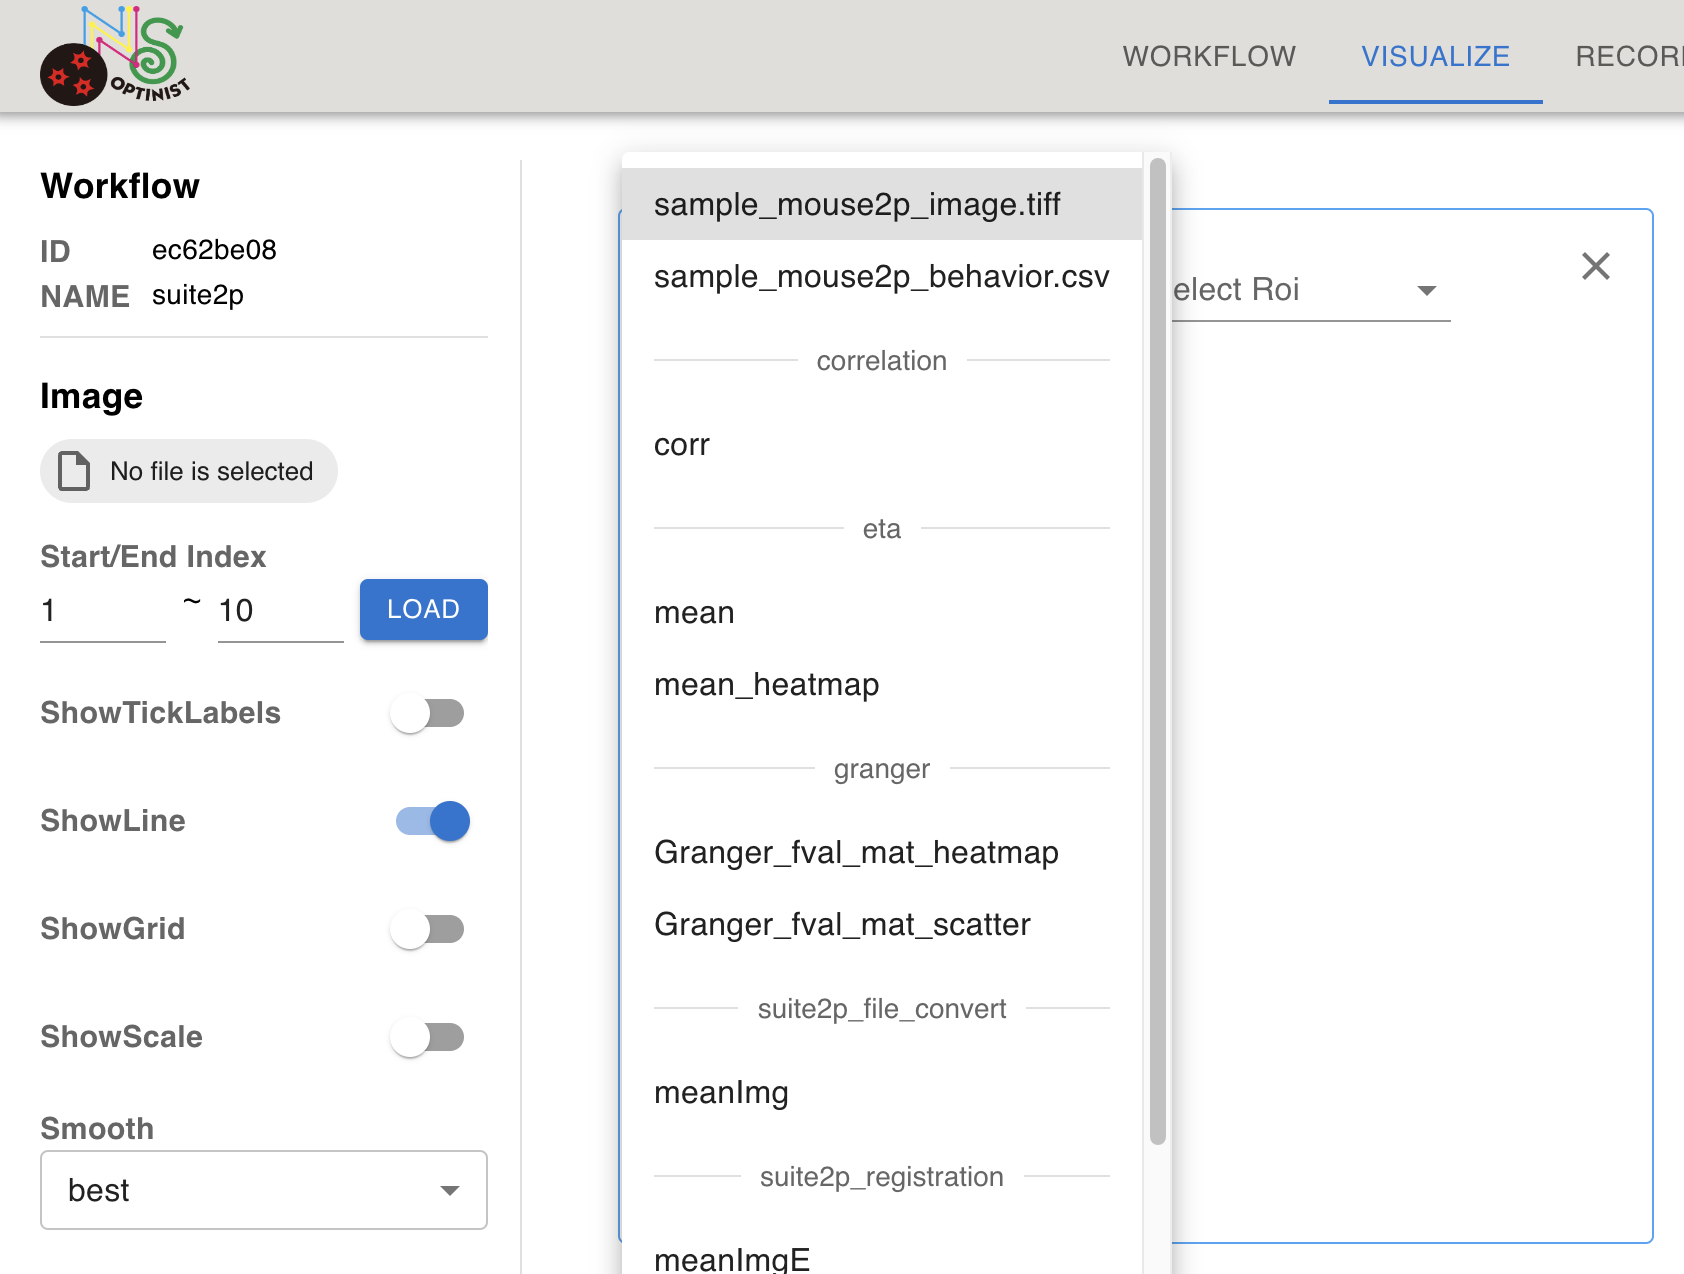
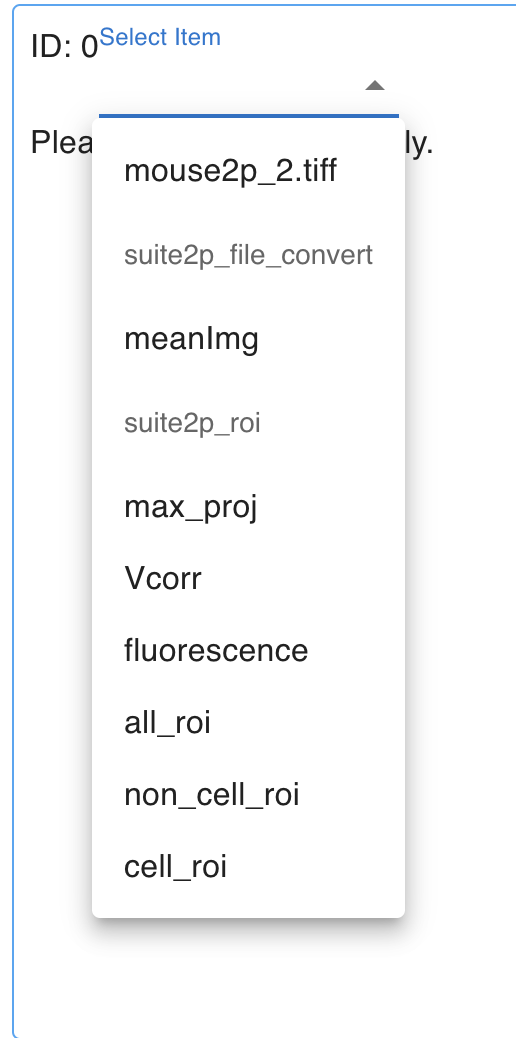
Selecting an item to show
Pull down of the Select Item shows the available item to show. Select one of these items.
Items are separated by the algorithm that created the item.
Checking movies
You may want to check some frames of the multi-page tiff files. Visualize page offers the way to check.
After creating a plot box by clicking on + mark, Select the image using the Select Item dropdown list.
Then you can select the range of the frame in Start/End Index of left sidebar. Assign 1st and last frame numbers, then clicking LOAD button starts loading the data.
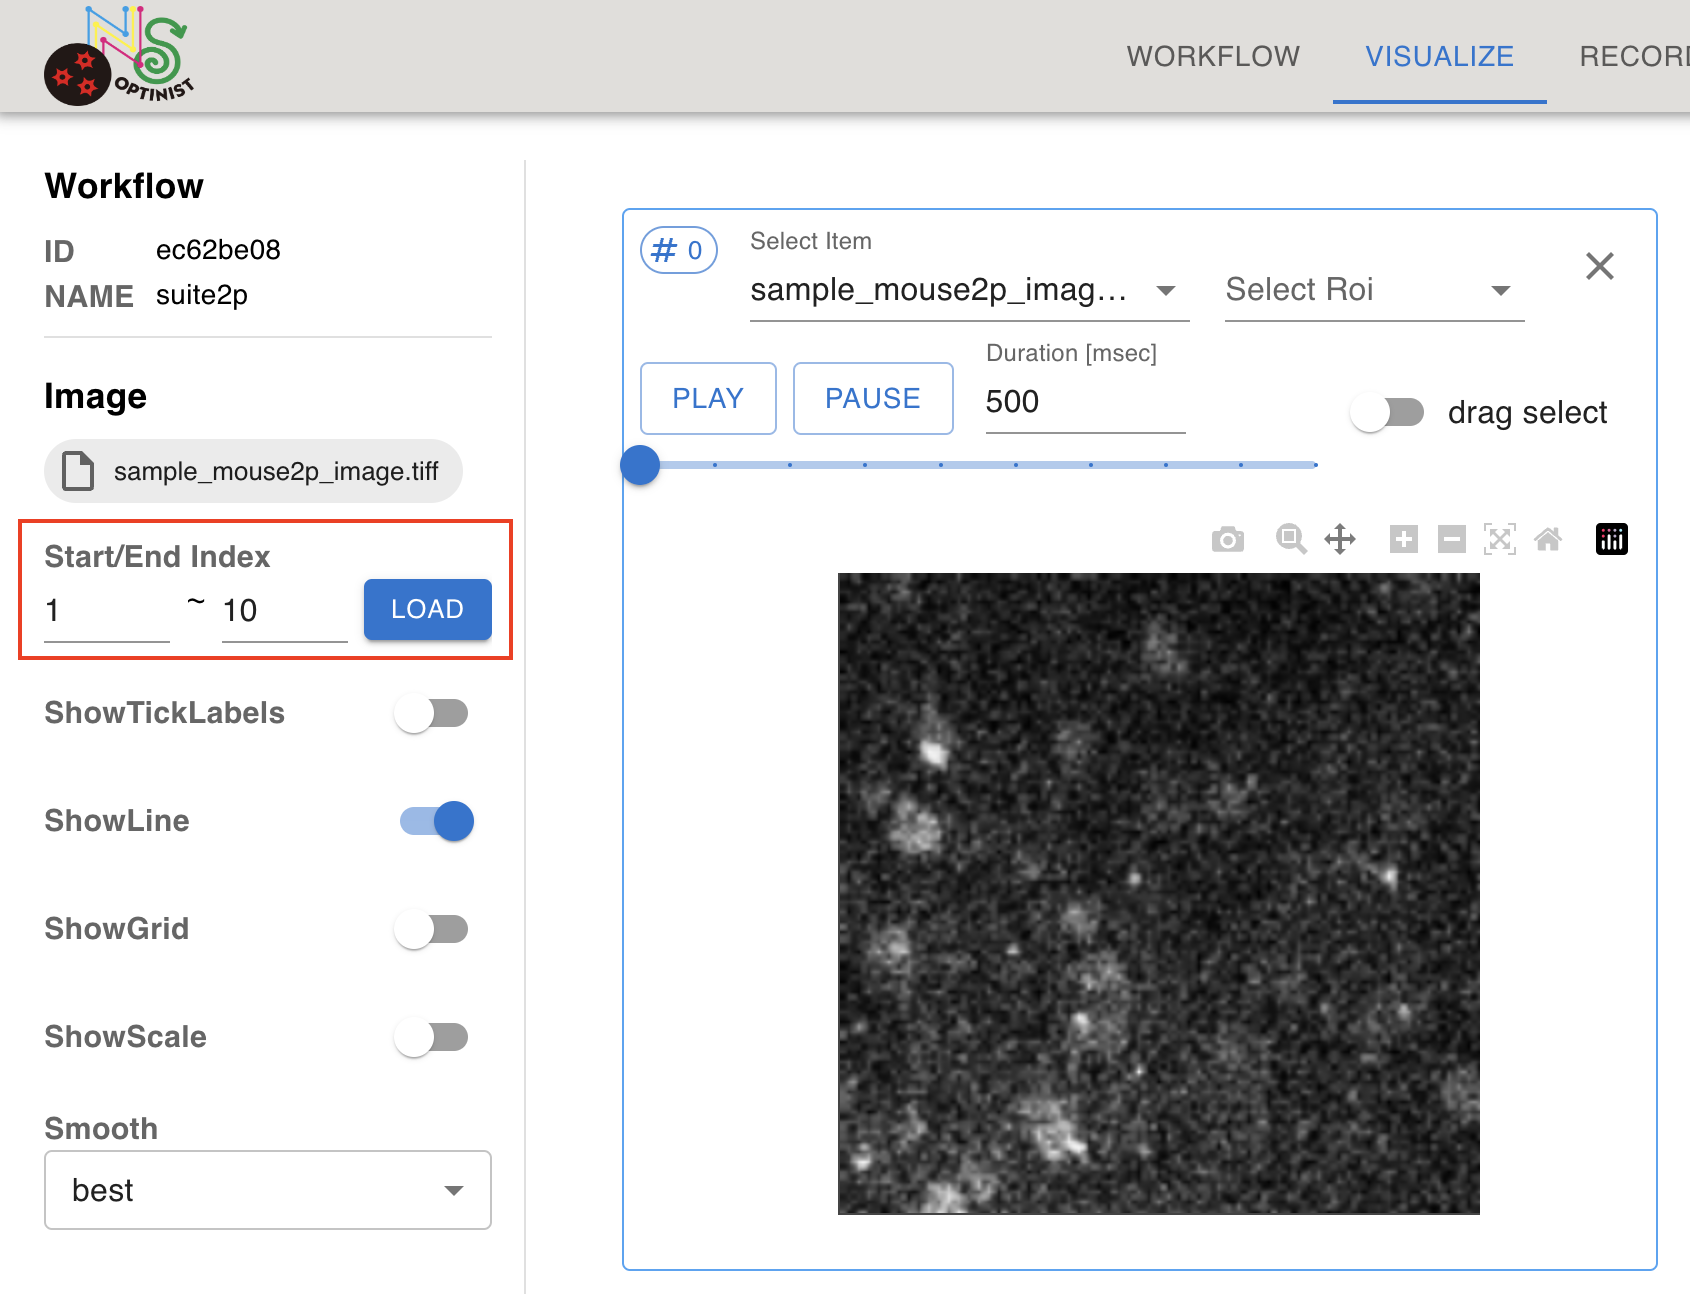
Click on the PLAY button within the plotting box to play the loaded movie. The number indicated on the right of PAUSE button is the frame interval in milliseconds.
Customizing visualization parameters
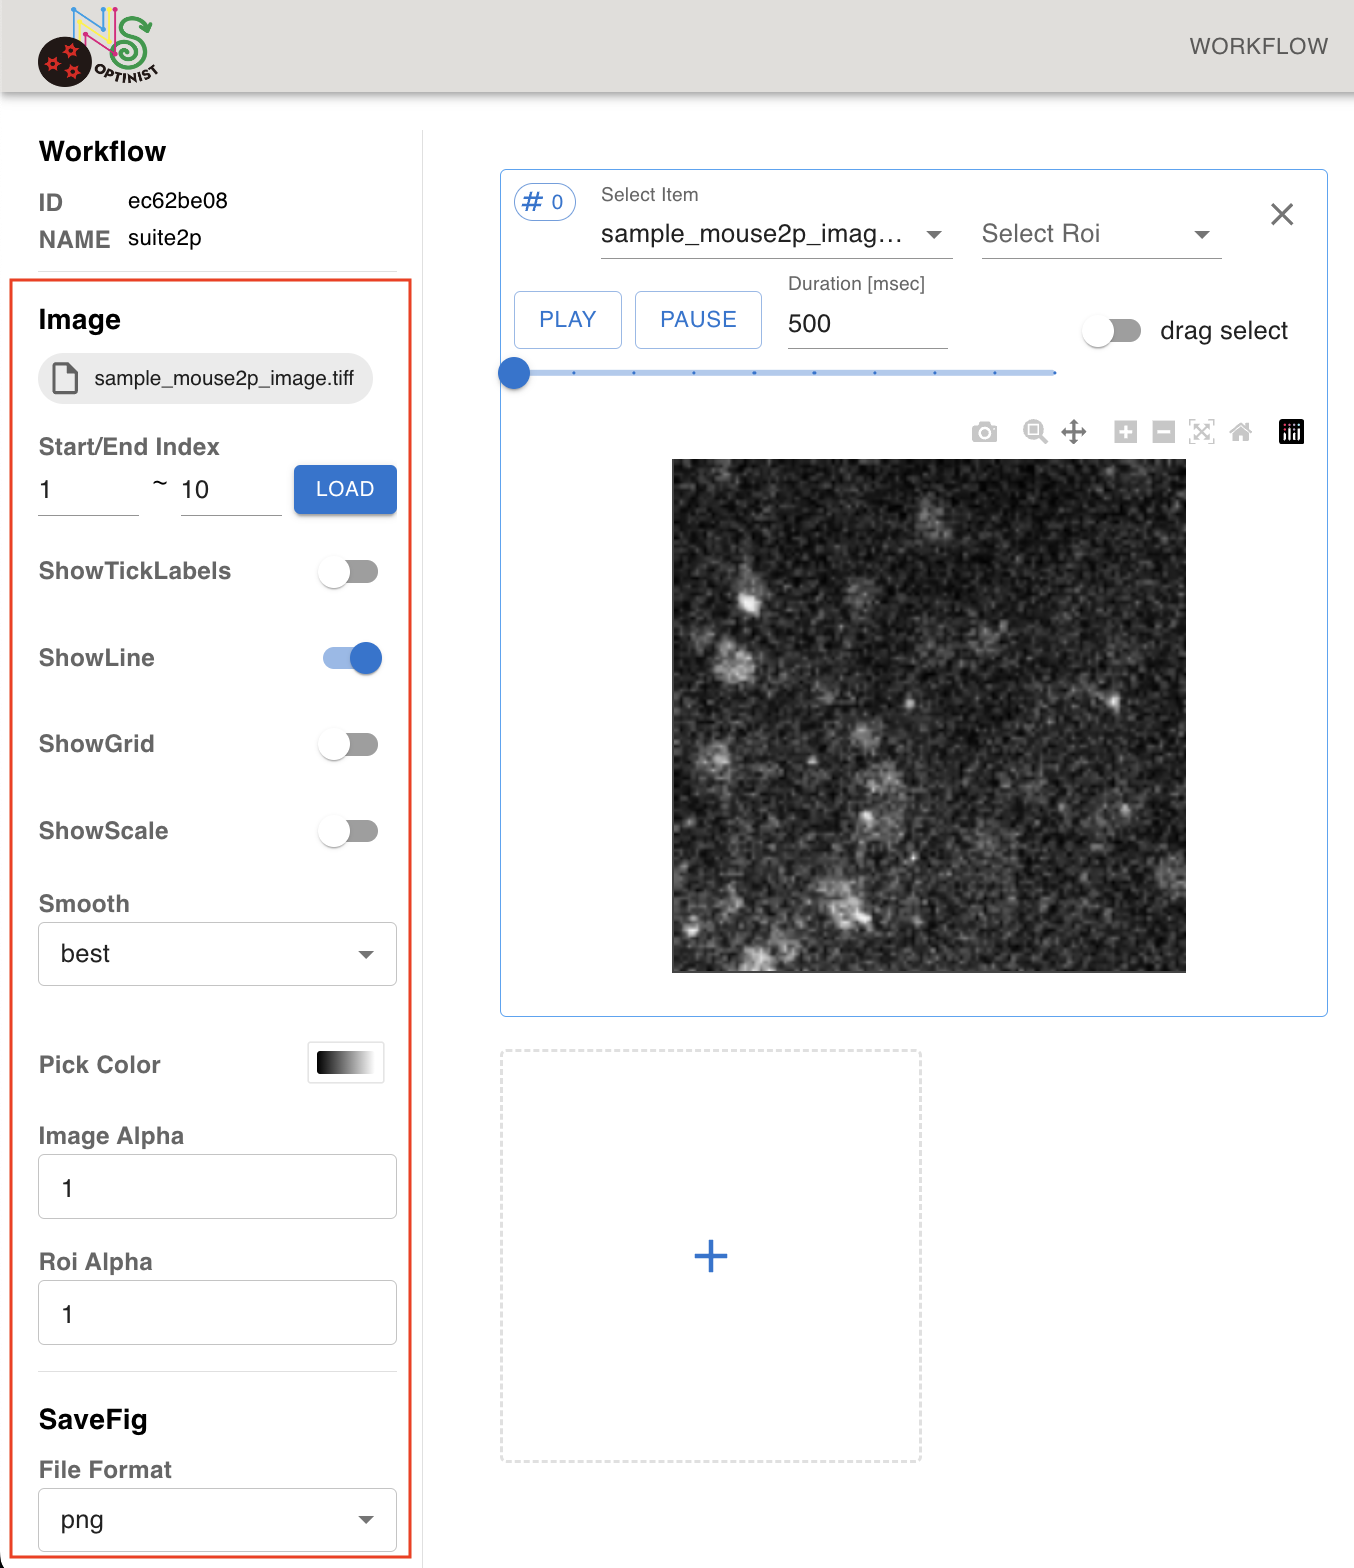
Select one of the display boxes by clicking inside of the box. Selected box will be highlighted by blue outline.
Left sidebar shows the parameters available for the selected box.
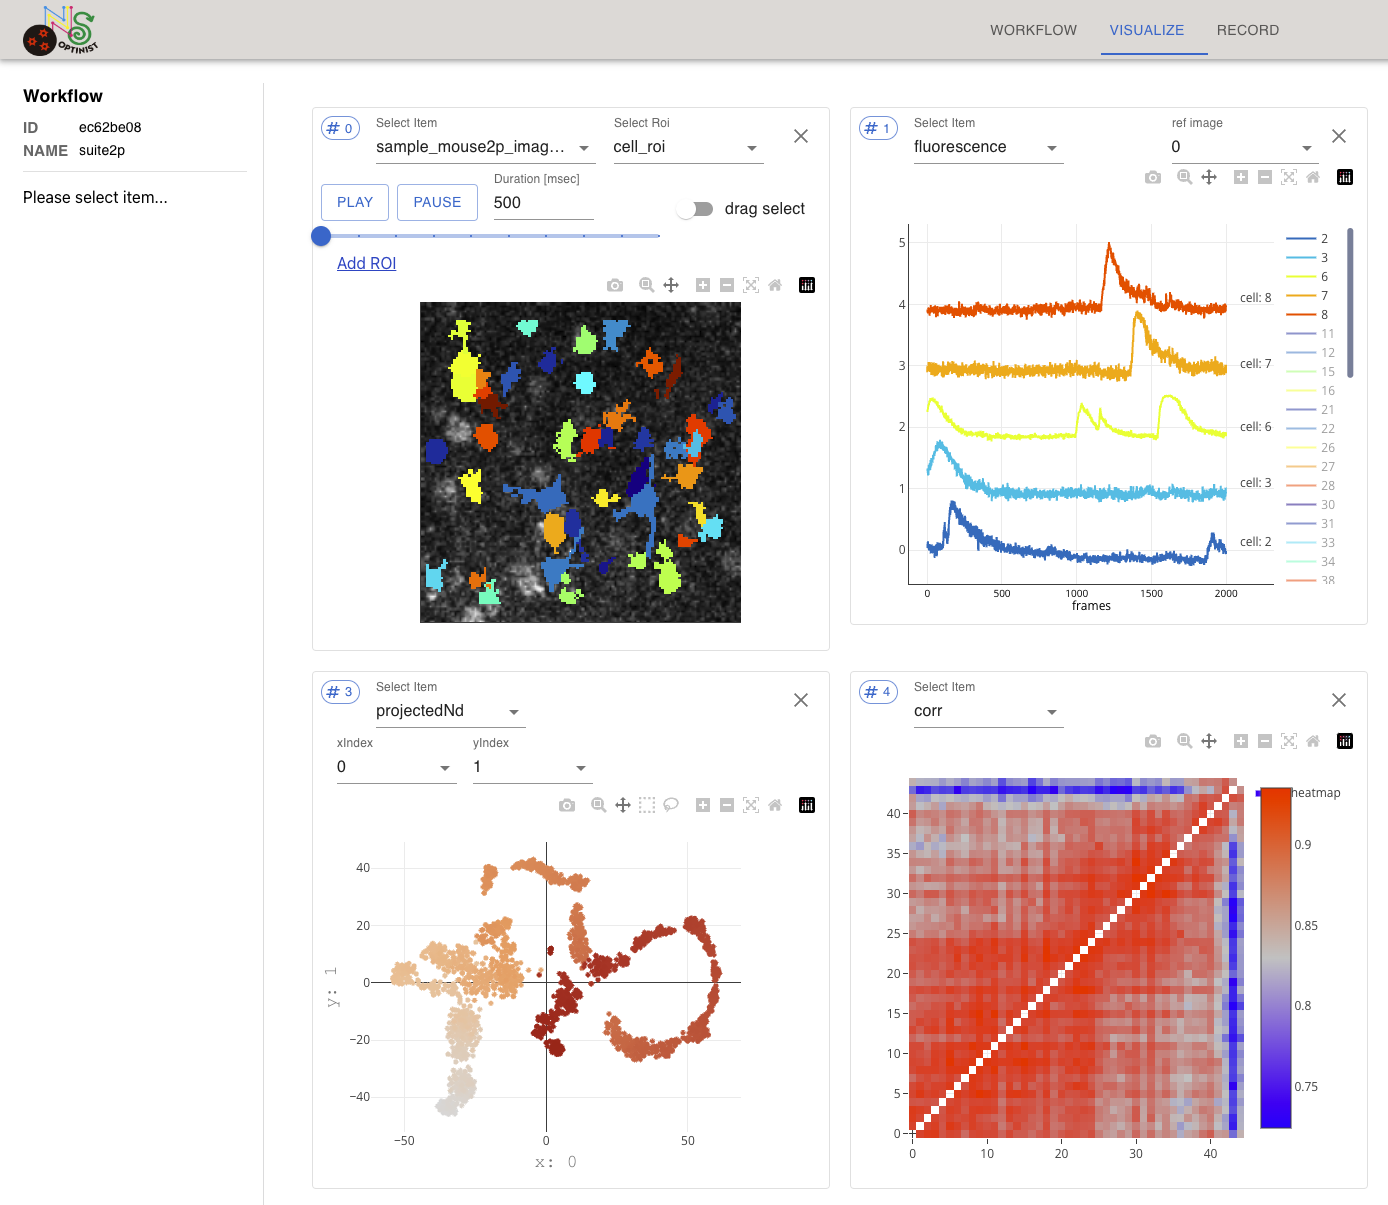
ROI and timecourse
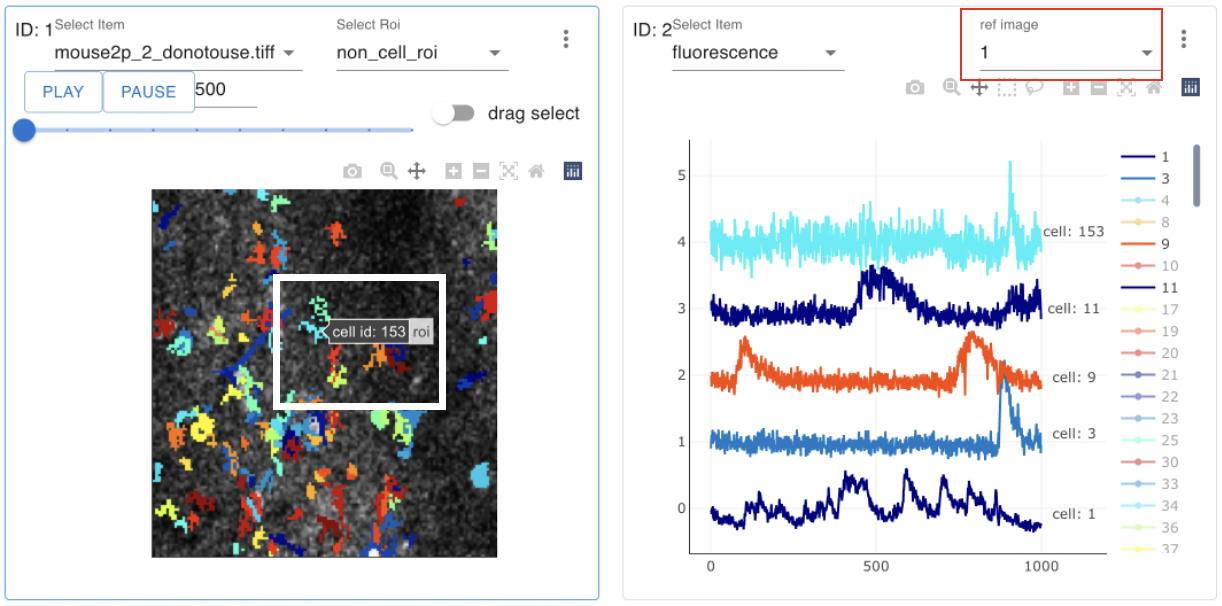
There is a way to link ROI plots and fluorescence time series.
Create One box showing ROI and another box showing fluorescence. You can link two boxes by setting ref image in the fluorescence box to be the ID of the ROI box. (ID of the box is on the left upper side). By clicking on the ROI of a cell, you can visualize the corresponding fluorescence time course in the fluorescence box. By turning on the drag select in ROI box, you can select multiple cells in the image at once.
Ref Image
TimeSeries plot can refer to a image plot to synthronize cell number index. Click or drag image plot so that cell number indexes are synthoronized in corresponding timeseries plot.
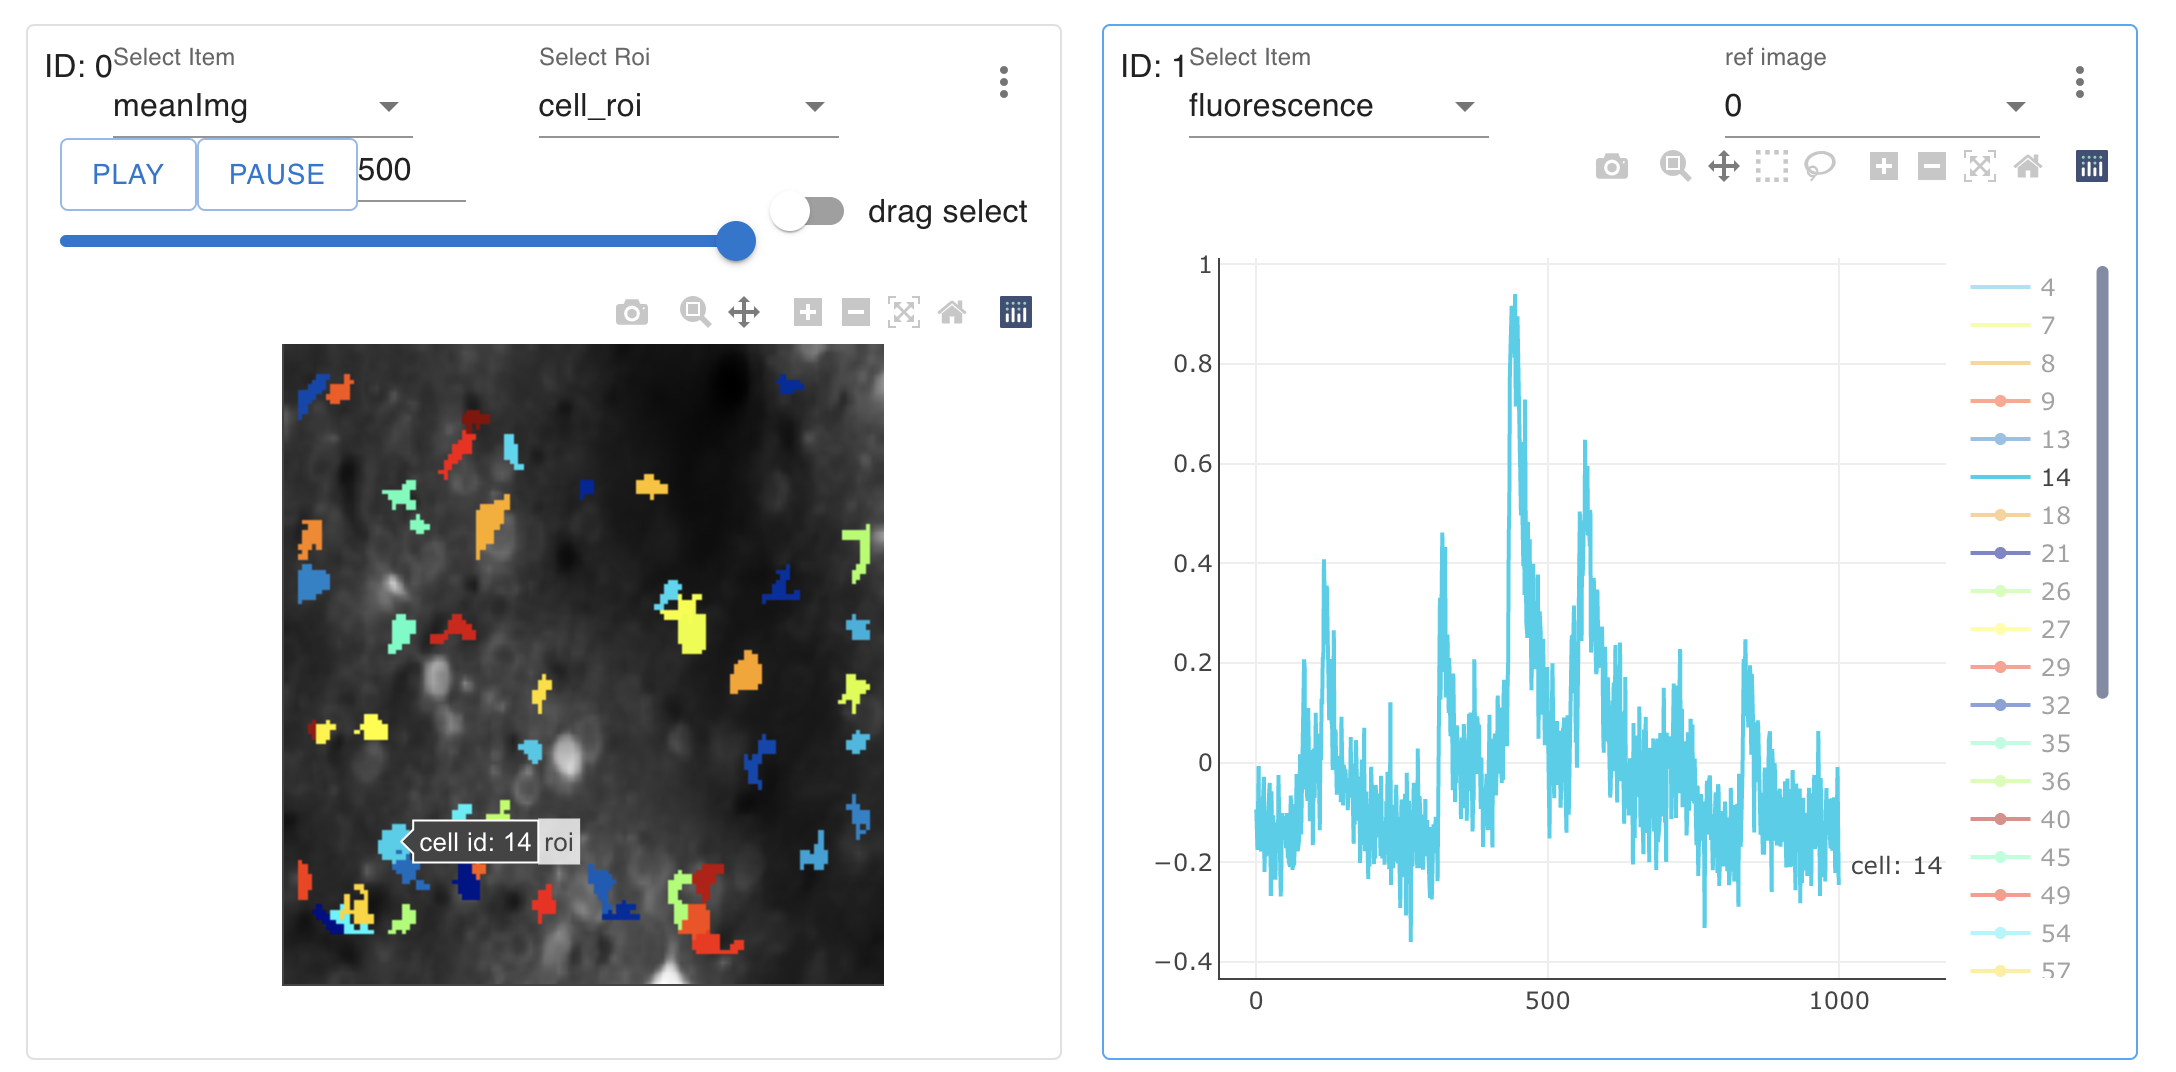
Showing ROI and time courses
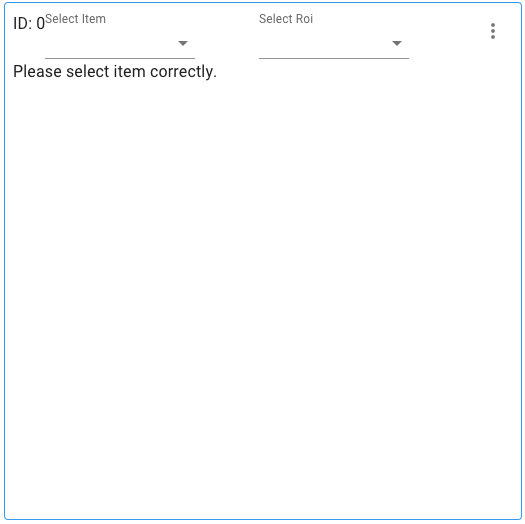
After running the ROI detection algorithms, the most often created plots are extracted cells’ shape and fluorescence time series. To show the plot, prepare two plotting boxes.
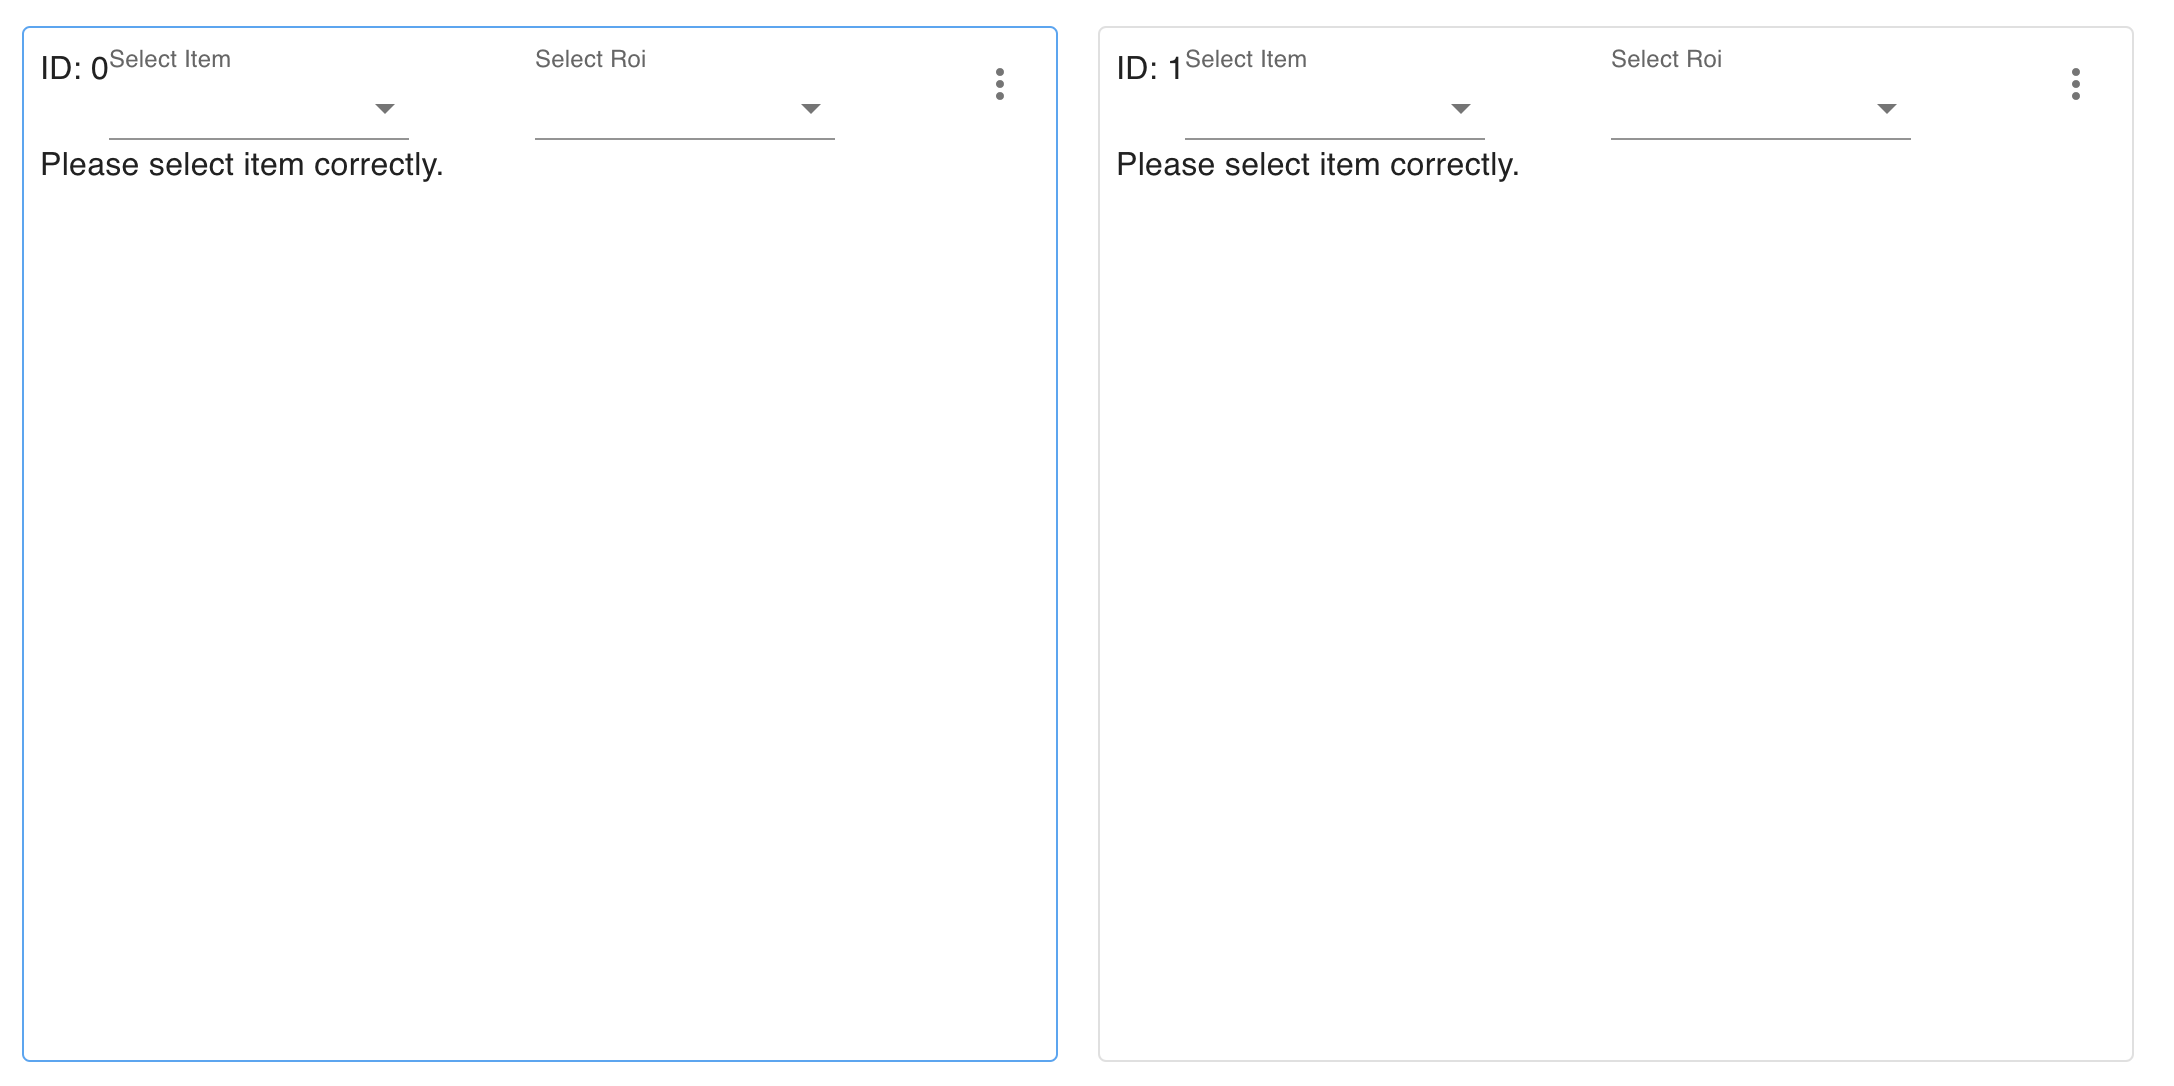
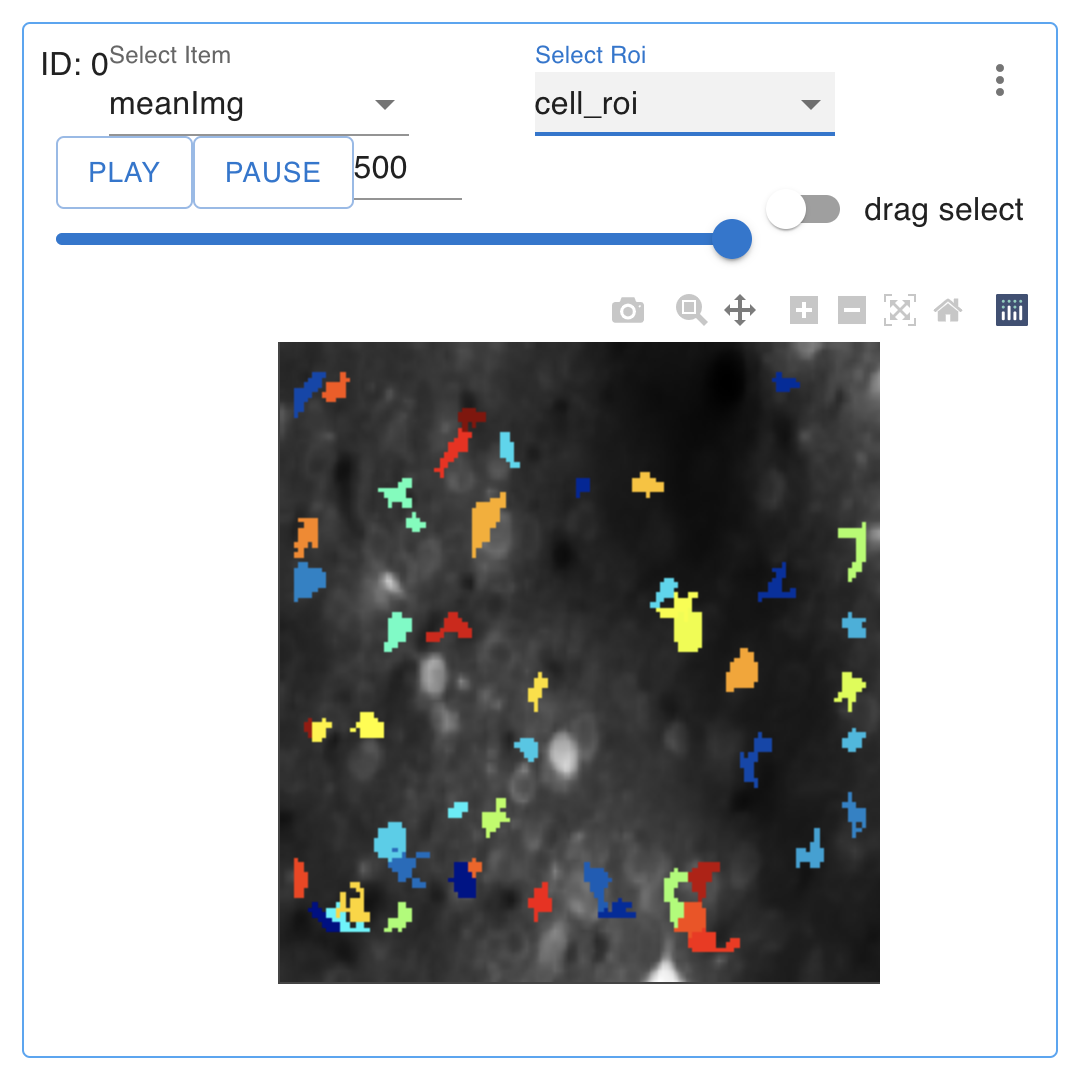
In one plotting box (ex, the one with ID:0), select a background image such as meanimg from the Select Item pulldowns.
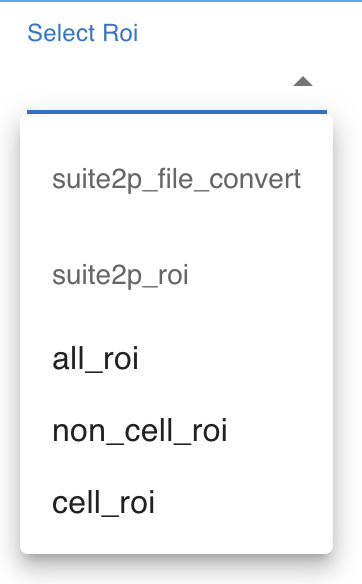
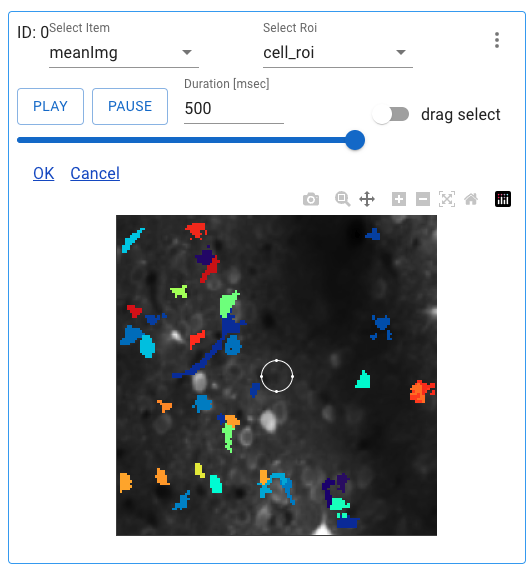
In the same plotting box, select cell_roi from the Select Roi pull-downs. Both Suite2P and CaImAn include the process to drop the extracted ROIs that do not meet the criteria. In OptiNiSt, the cell ID is given to all the ROIs. Cell_roi is the ROIs that passed the criteria.
The plotting box (ID:0) shows the background image and detected cells.
In another plotting box (ex, the one with ID:1), select fluorescence from the Select Item pulldown. And select 0(same ID with the plotting box of your ROI image) from the ref image pull down. By doing this, the two plotting boxes are linked.
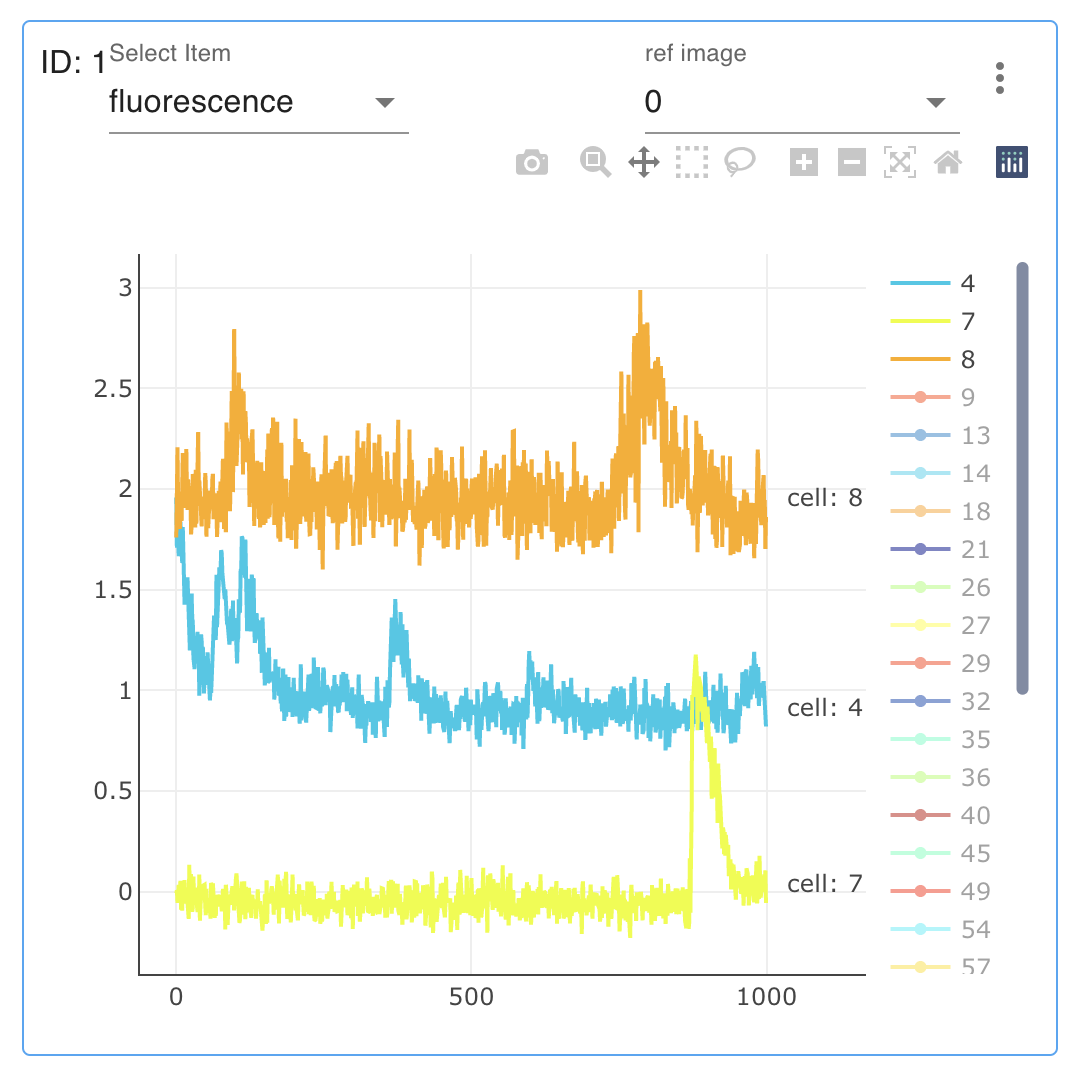
Now you can explore the ROI and time course. The color of ROI and corresponding time course is matched. You will know the cell ID by letting your mouse over the cell in the image. Clicking on the cell automatically adds the fluorescence time course of the clicked cell.
Note
Cell’s ID starts from 0 from version 1.0.0
In the previous versions, starts from 1.
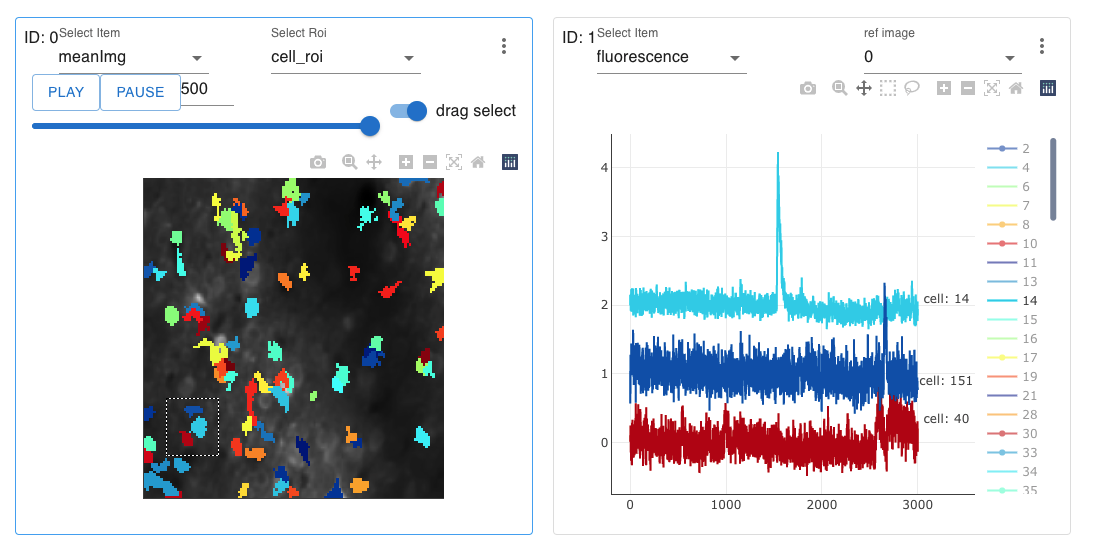
If it is tiring to select the cell by clicking one by one, turn on the drag select button on the right in the plotting box of ROI. It enables selecting all the cells within the rectangular area you define.
Switch time course plot units
By default, timecourse plot’s x axis is frame number. You can switch to time unit by clicking “range unit” in left side bar.
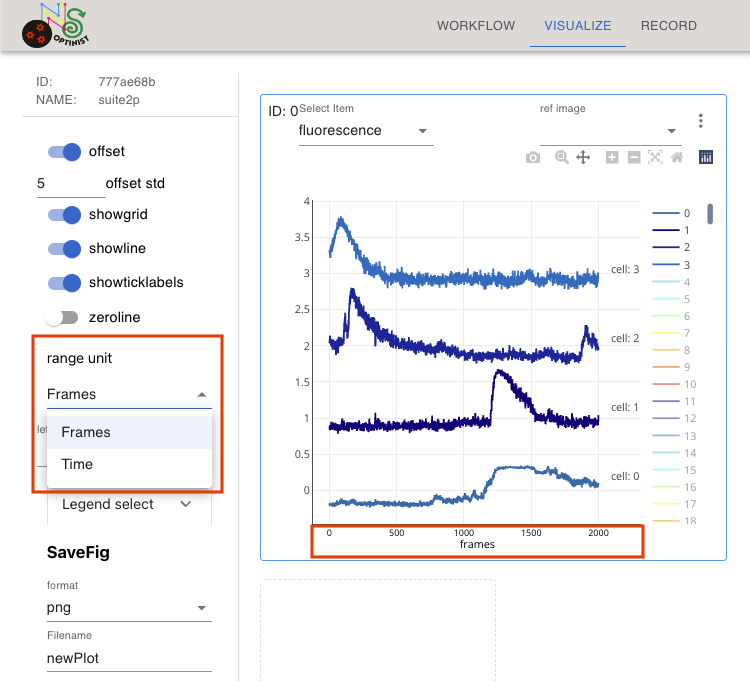
If you change unit to “time”, plot’s x axis is changed to time(sec).
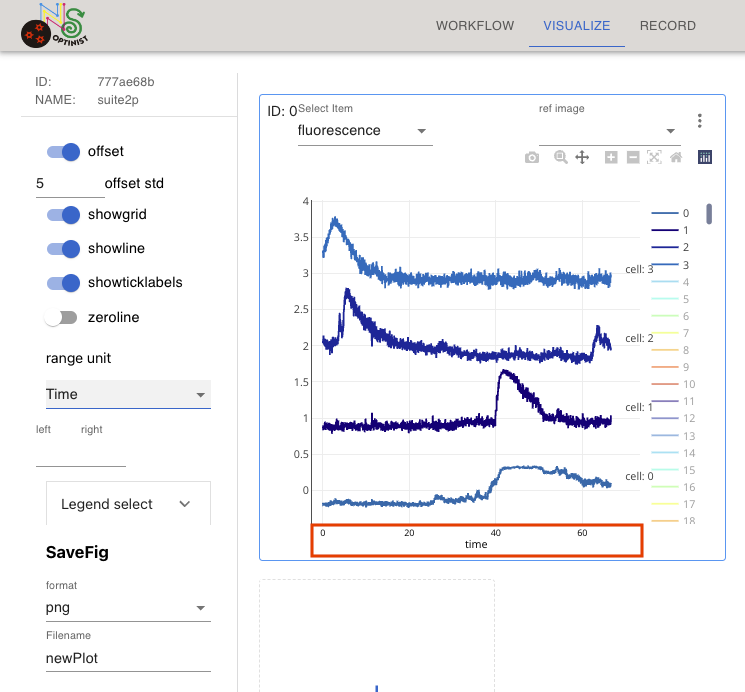
The time is calculated from imaging_plane.imaging_rate, in NWB settings.
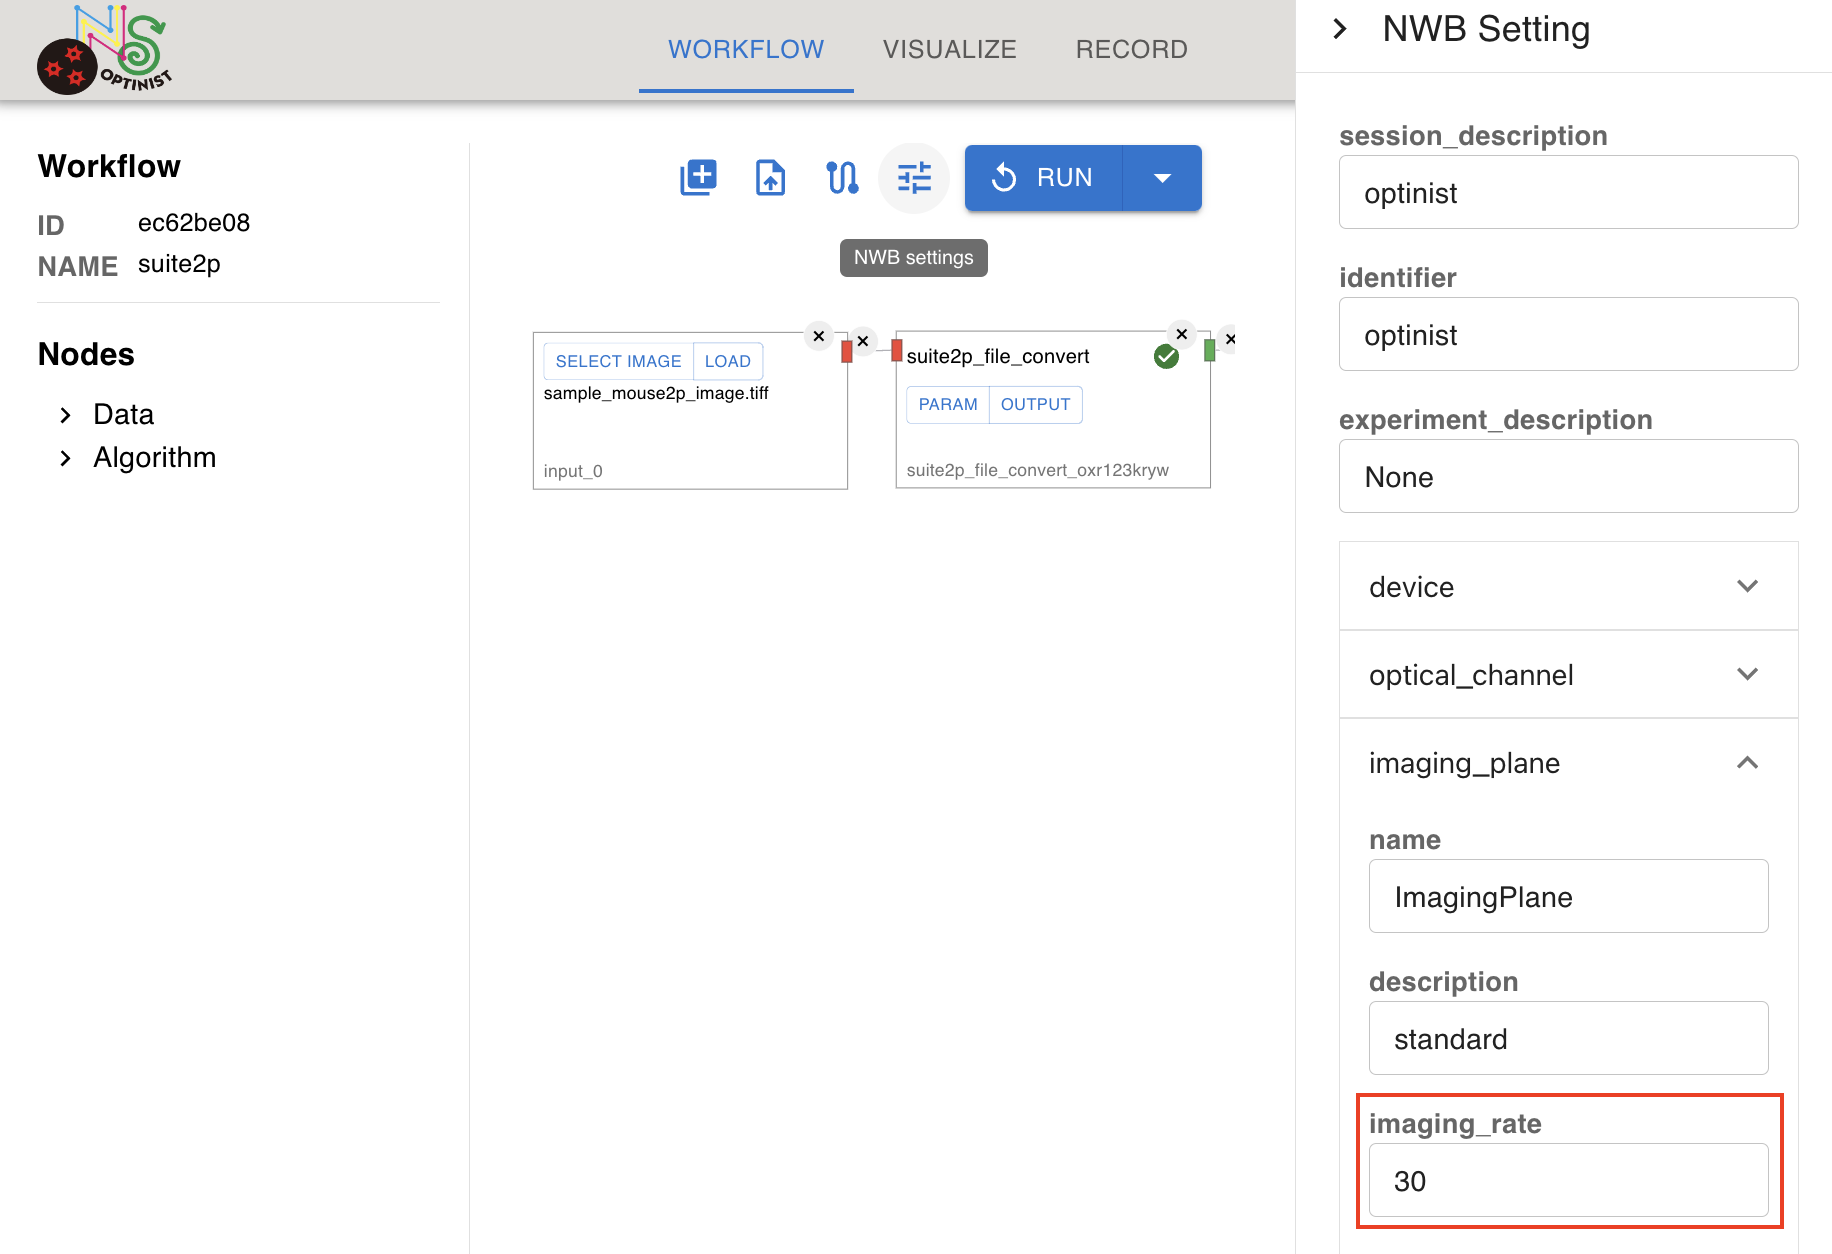
Important
The NWB settings parameter imaging_rate is also used as parameter for frame rate like fs in suite2p.
So, be sure if your imaging_rate is set correctly before running workflow.
Editing ROI
To the edit roi, prepare a plotting box.
In one plotting box (ex, the one with ID:0), select a background image such as meanImg from the Select Item pulldowns. In the same plotting box, select cell_roi from the Select Roi pull-downs.

You can click the Add ROI button then drag drop, resize the white circle to change the new ROI position and size. Press OK or Cancel button to Add or No
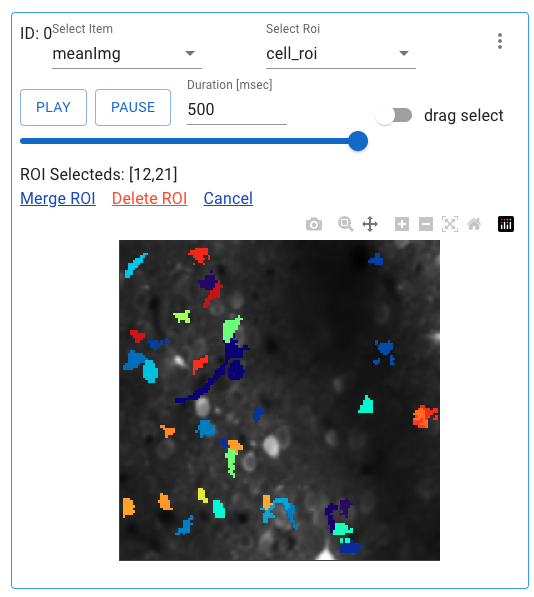
Or click on each cell ROI to delete ROI or merge ROIs (when you select 2 or more ROI cells) Press Merge ROI or Delete ROI or Cancel button to Merge or Delete or No.
NWB file is overwritten with the ROI edit information.
Note
ROI edit information in NWB file
common
edited ROI ids are recorded in processing/optinist section
specific
merge
iscell data of ROIs to be merged changes to False
ROI after merge are added with new ID
delete
iscell data of deleted ROI changes to False.
saving plot as image file
You can save created plots in svg, png, jpeg, or webp format.
Please select the format and set the file name on the the SaveFig section in left panel. Then click the camera mark in the plotting box.
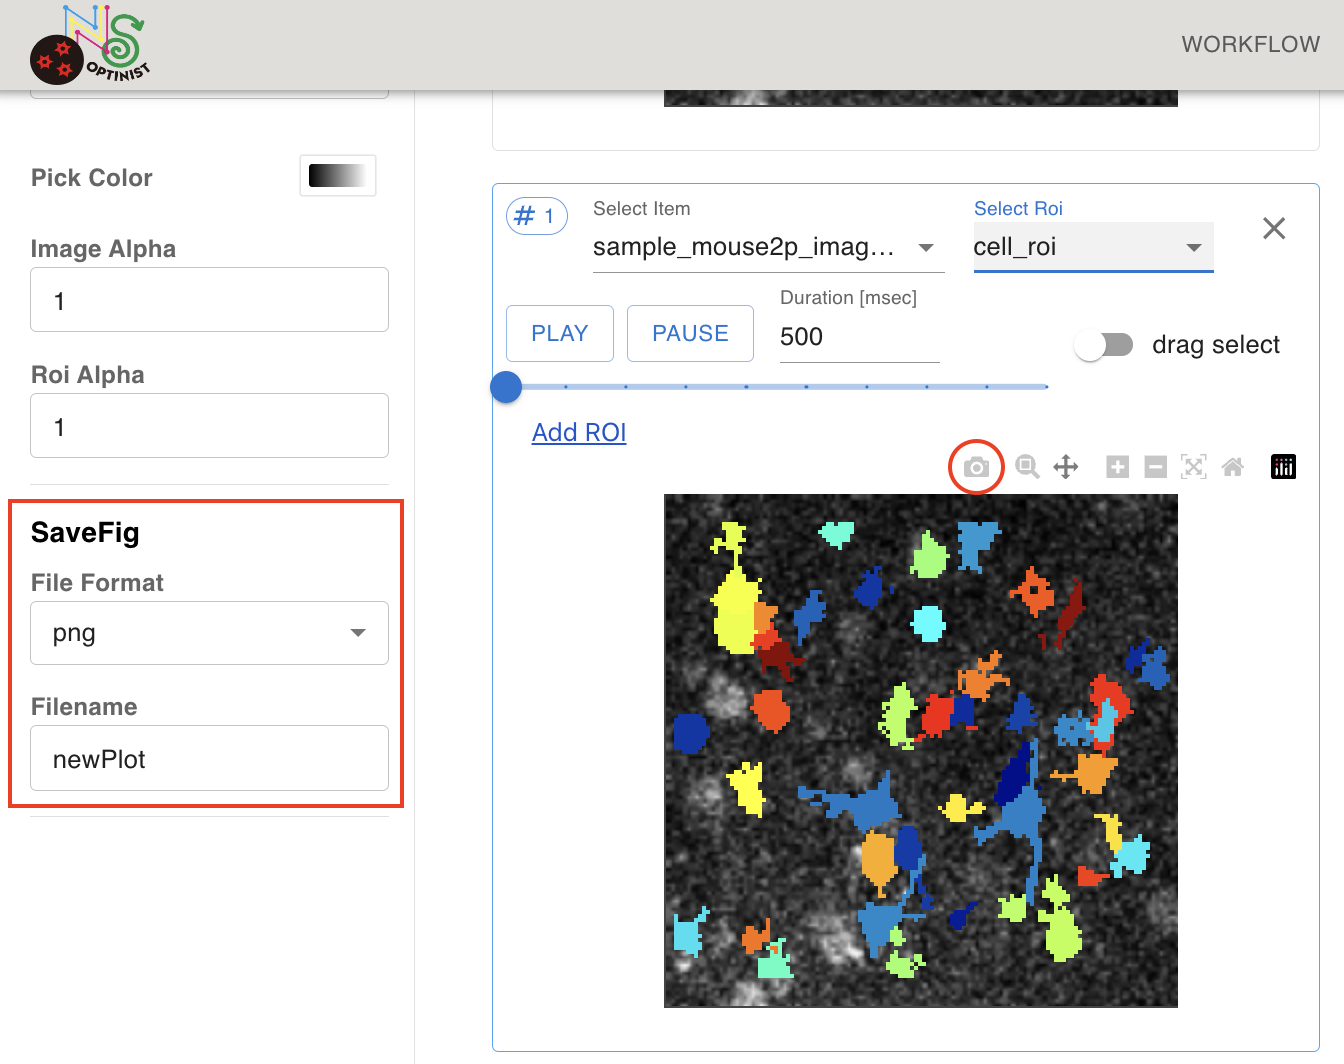
Svg format saves the plot as a vector-based graphical format which may be convenient when you need high-resolution figures.